參考下列幾個網址寫出來的code (for Matlab)
http://lsa.colorado.edu/papers/dp1.LSAintro.pdf
https://blog.csdn.net/pipisorry/article/details/42560331
https://read01.com/zh-tw/0zeKRM.html#.W7C8PhMzbKZ
C=[ [ 0,0,1,1,0,0,0,0,0 ];
    [ 0,0,0,0,0,1,0,0,1 ];
    [ 0,1,0,0,0,0,0,1,0 ];
    [ 0,0,0,0,0,0,1,0,1 ];
    [ 1,0,0,0,0,1,0,0,0 ];
    [ 1,1,1,1,1,1,1,1,1 ];
    [ 1,0,1,0,0,0,0,0,0 ];
    [ 0,0,0,0,0,0,1,0,1 ];
    [ 0,0,0,0,0,2,0,0,1 ];
    [ 1,0,1,0,0,0,0,1,0 ];
    [ 0,0,0,1,1,0,0,0,0 ]; ];

[w,s,p]=svd(C);

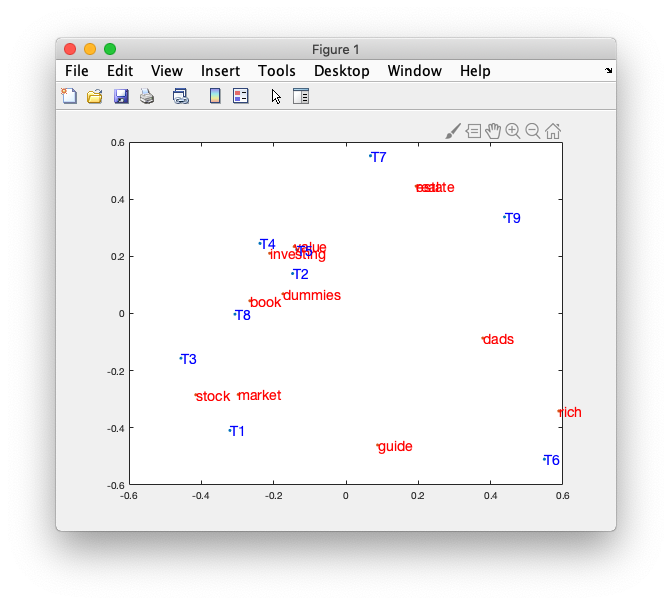
plot(-p(:,2),-p(:,3),'.')
hold on
plot(-w(:,2),-w(:,3),'.')


Label_1={'book';'dads';'dummies';'estate';'guide';'investing';'market';'real';'rich';'stock';'value'};
text(-w(:,2),-w(:,3),Label_1,'Color','red','FontSize',14);

Label_2={'T1';'T2';'T3';'T4';'T5';'T6';'T7';'T8';'T9';};
text(-p(:,2),-p(:,3),Label_2,'Color','blue','FontSize',14);
hold off
結果呈現如下:

文章短網址: https://slanla.com/__vjkmxi
